
 Workpapers CS

We moved!
Help articles have been migrated to the new Help and Support. You can find help for your products and accounts, discover FAQs, explore training, and contact us!
Repeating elements in report or financial statement layouts in the Report Designer can include text, amounts, variables, formulas, and functions, that you can layer or nest in groups of repeating elements, as well as format the report so that repeating elements can appear horizontally across columns in a single row.
Grouping elements into a Repeating Level
Grouping repeating levels in the Report Designer enables you to tie related data together in a selected area of a report. All data that is defined by the variables for a specified grouping is repeated in that level until there is no more data available to repeat. A repeating level is marked by a vertical bracket in the left margin of the design grid. You can create multiple repeating level groups at the same level or nest them to create layered/nested levels.
In the design grid, highlight the rows to include in the repeating level, and then choose Group into Repeating Level from the right-click context menu.
Example
The following example illustrates grouped repeating levels that are nested. Nested repeating levels are numbered consecutively at the top of the margin as they are added in the design grid.
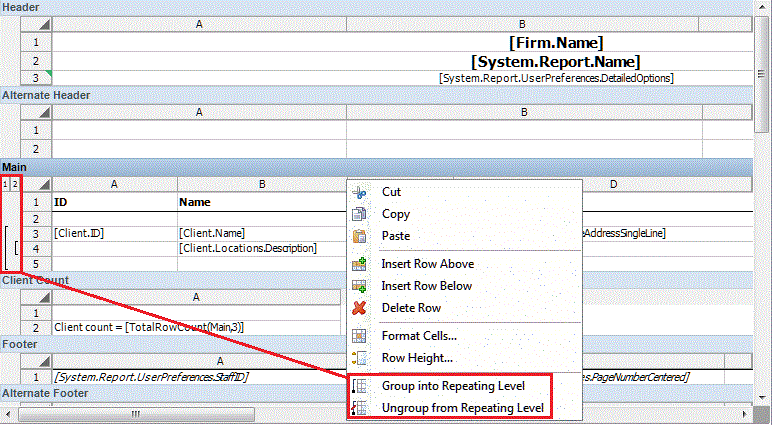
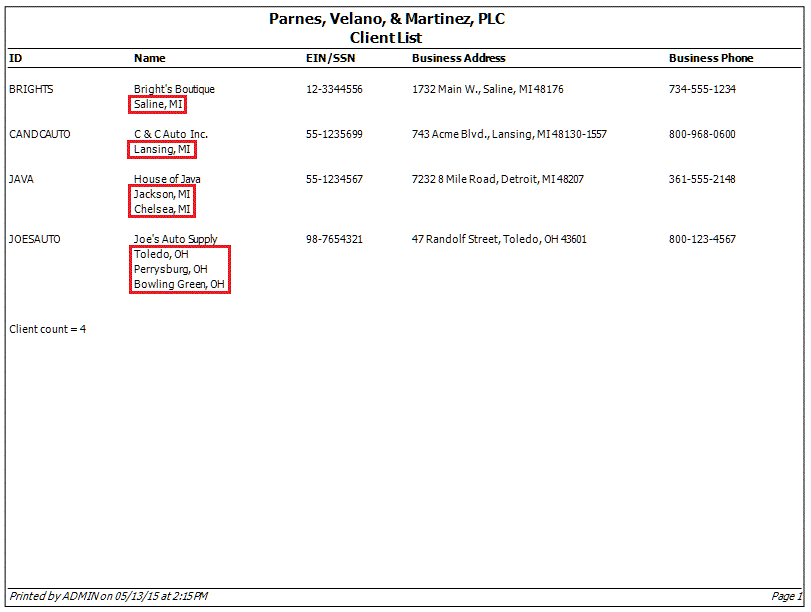
In this example, the nested row 4 (repeating level 2) contains a variable [Client.Locations.Description] that repeats and prints below each client variable [Client.Name] (repeating level 1, rows 3 through 5) in column B of the report.
Note: You can mark the Do not page break within groups checkbox in the Design Tools frame to prevent data groupings in repeating levels from breaking across pages when printing. For details, see Preventing data groupings from breaking across pages when printing.
Creating unique repeating regions in a report
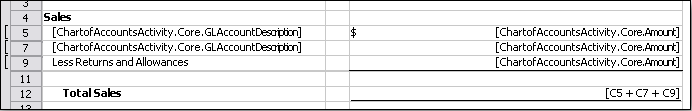
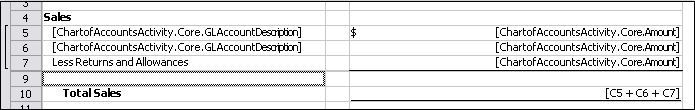
Unique repeating regions in a report must be separated by hidden rows in the design grid so that each account classification / subcode combination is grouped together into a specified type and processed sequentially before moving to the next row of information in the report. In the following typical income statement (Income Statement - Current Year), three different Account Classification / Subcode combinations (INC : SALE, INC : No subcode, and INC : RET) are grouped in the Sales category followed by a single Totals row.
Each Account Classification / Subcode combination has two accounts assigned.
- Row 5: Accounts 401 (Foods Sales) and 405 (Clothing Sales) are assigned to: INC : SALE
- Row 7: Accounts 403 (Lottery Winnings) and 404 (Misc Income) are assigned to: INC : No subcode
- Row 9: Accounts 402 (Returns) and 406 (Allowances) are assigned to: INC : RET
Each row is grouped into a repeating level (indicated by the square bracket to the left of each row number) displays all accounts of a specified type.
Note: Rows 6 and 8 must be hidden in the design grid so that each account classification / subcode combination can be processed by the application before moving to the next grouping in the report.
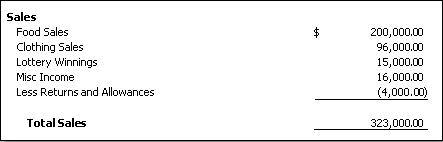
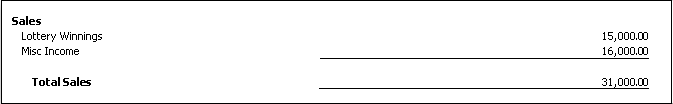
The following screen illustrates how this section of the income statement displays when previewed:
Example: Repeating regions incorrectly implemented
The following is an example of repeating regions in the same income statement that are implemented incorrectly. Notice that rows 5 through 7 are grouped into one repeating region instead of being grouped into three separate sections, and there are no hidden rows to separate the Account Classification / Subcode combinations.
In the following illustration, the incorrect repeating regions are displayed in a preview of the report.
Repeating variables horizontally across columns
In the Cell Properties section of the Design Tools frame of the Report Designer, mark the Repeat right checkbox for each instance of a variable to repeat across multiple columns in the same row.
Example
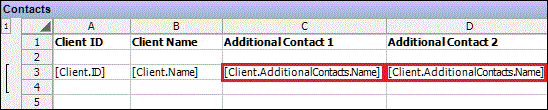
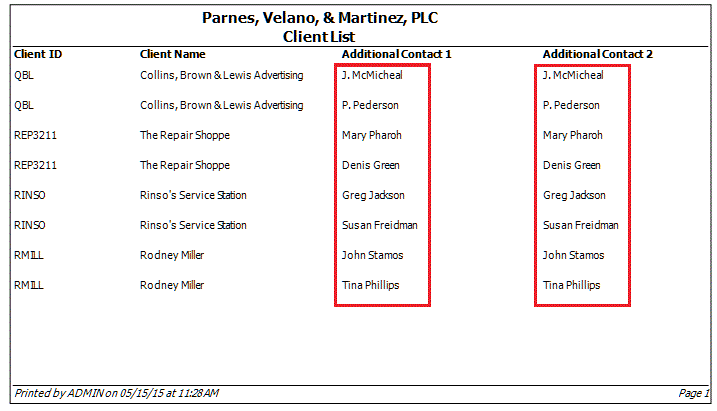
The following example is a customized version of the Client List report that includes a repeating region that contains additional contacts for each client of the firm. That information is defined by a the variable [Client.AdditionalContacts.Name] to be printed across two columns (C and D) in the repeating level.
To display the variable values across columns in a single row, mark the Repeat right checkbox in the Cell Properties section of the Design Tools frame for each cell that contains the [Client.AdditionalContacts.Name] variable.
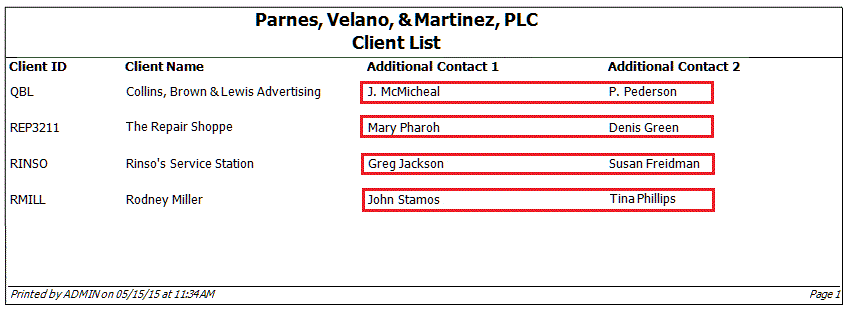
The following illustration shows what the section of the Client List report looks like when Repeat right checkbox is marked for the cells that contain the [Client.AdditionalContacts.Name] variable. Notice that the same variable changes across columns of a single row.
The following illustration shows what the section of the Client List report looks like when the Repeat right checkbox is not marked for the cells that contain the [Client.AdditionalContacts.Name] variable. Notice that the same variable repeats across the row and changes down the column.
Was this article helpful?
Thank you for the feedback!

|
|

|
Get the most out of your Thomson Reuters Tax & Accounting products. Our continued learning packages will teach you how to better use the tools you already own, while earning CPE credit. Learn more. |

|
|

|
Chat - Best option for simple questions Call us at +1 800 968 0600. You might like to see our hours and menu options before calling |