


We moved!
Help articles have been migrated to the new Help and Support. You can find help for your products and accounts, discover FAQs, explore training, and contact us!
In the Report Designer, you can manipulate the contents of your reports, financial statements, and letters by adding and modifying the various elements within the design grid. As you start to use the Report Designer, it may be helpful to learn some of the common terms to help you navigate some of the more complex concepts. The Report Designer elements can contain text, numerical amounts, formulas, or variables.
- Cell. A single unit of data for a row/column within the design grid. To select a cell, click in the cell.
- Row. A horizontal group of cells within the design grid. To select a specific row, click the number button to the left of the first column in the grid for the selected row.
- Column. A vertical group of cells within the design grid. To select a specific column, click the header button at the top of the column.
- Variable. A system-defined label that represents specific types of information. Variables are the "building blocks" of a document and enable client data from various areas of the application to flow into a document. Variables available for selection are listed in the variable tree within the Design Tools frame. Expand the applicable variables category and subcategories as needed to find the variable you need, and then double-click the variable to insert it in the grid. Show me.
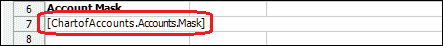
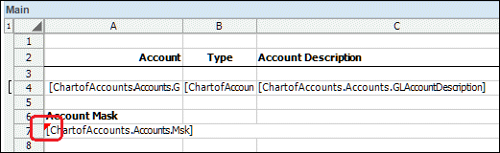
If the Report Designer displays a red triangle within a cell, that indicates that the cell contains an invalid or incomplete variable. Review and correct the variable entry as needed. Show me.
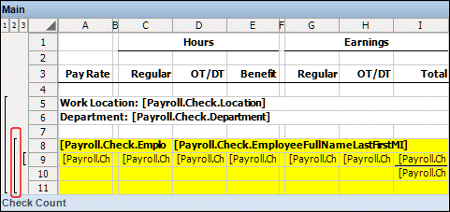
- Repeating level/Group. A group of rows within the design grid that contains variables for data that you want to repeat using the same format. If necessary, you can create nested repeating levels. Repeating levels are designated by a vertical bar to the left of the row numbers. To select a repeating level, click the numbered button above the vertical bar that designates the repeating level in the left margin of the design grid. Show me.
For details, see Using repeating elements in reports or statements.
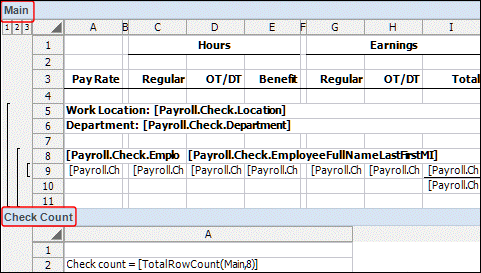
- Region. A section of a report that can be expanded by inserting additional rows and columns, as necessary. Using regions is an easy way to separate information into different sections within a report. Show me.
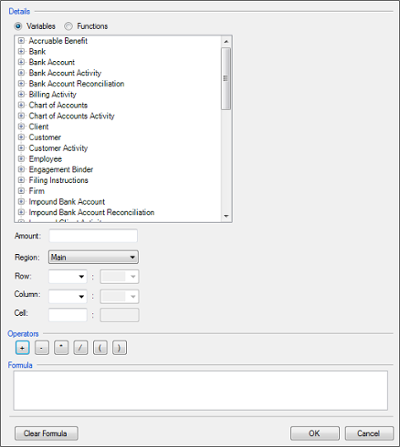
- Formula. A group of variables, functions, and/or operators placed in a specific order to indicate a procedure for the application to calculate. Click the Insert Formula
 button to open the Formula dialog, and then define the formula. Show me.
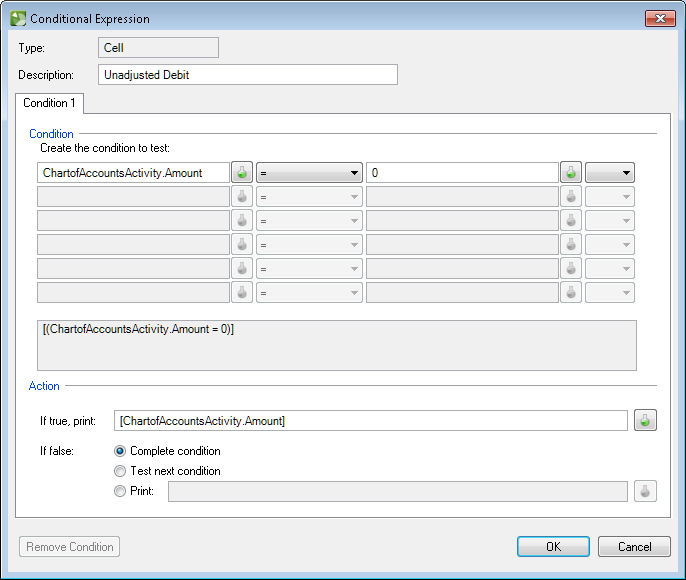
- Conditional Expression. A group of if-then statements that include or exclude specific data in a report, based on the selected criteria in the expression. To insert a conditional expression, highlight the applicable cell or row, and then choose Insert > Conditional Expression. To view or modify a conditional expression, select the cell or row that contains the expression and choose Format > Conditional Expression. Show me.
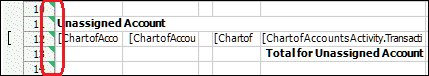
The Report Designer displays a green triangle in cells and/or rows that include a conditional expression. Show me.
For details, see Conditional expression dialog.
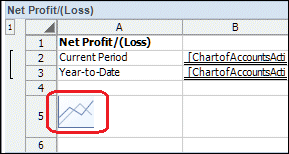
- Chart. A graphical representation of client information, based on the options you choose. The Report Designer displays a chart placeholder image in the cell to indicate that the report will print a chart in that location. Show me.
Was this article helpful?
Thank you for the feedback!

|
Adding or removing columns and rows |

|
Get the most out of your Thomson Reuters Tax & Accounting products. Our continued learning packages will teach you how to better use the tools you already own, while earning CPE credit. Learn more. |

|
|

|
Chat - Best option for simple questions Call us at +1 800 968 0600. You might like to see our hours and menu options before calling |