


We moved!
Help articles have been migrated to the new Help and Support. You can find help for your products and accounts, discover FAQs, explore training, and contact us!
In the Report Designer, you can use the Design Tools frame to format text and add variables to your reports. To further customize your reports, you can specify element properties at the region, row, column, cell, and group level. To do this, highlight the element in the design grid, and then select the options in the properties pane.
To display the Properties pane for a particular element (row, column, or cell) in the Design Tools frame, highlight the element in the design grid. To select multiple elements of the same kind, press and hold the CTRL or SHIFT key while clicking the elements.
Use the fields in the Properties pane to define the contents of the selected element.
- Region. Displays the name of the region that corresponds to the current selection.
- Row/Column/Cell. Displays the number of the selected element. If more than one element is selected, it displays the number of the first element in the selection.
- Contents. Enter text or click the Insert Formula
 button to define a formula to calculate the data to display in the element. The application automatically enters the data defined by the formula or text entered in this field.
 - Grouping type/Grouping content. (Accounting reports only) Select the grouping type and then either select the applicable grouping content, or click the Insert Formula button to define a formula to calculate the content to display.
- Sort order/Sort column. (Row Properties only) Select the criteria to use for sorting the data in the selected row — GL account, GL account description, Amount ascending, or Amount descending. If you select to sort by amount, select the column on which to sort the data.
- Period. Select the code for the time period from which to pull amounts, or click the Select Period
 button to open the Period dialog and select the period or define a formula to calculate the data to display.
 - Amount type. Select the amount type for the elements — balance, debit, or credit.
- Basis. (Accounting reports only) Select the basis for the selected elements.
- Segments. (Column and Cell Properties only) Select a segment from the list of available segments that were set up for the client in the Setup > Account Segments screen.
- Title row/column. To designate the selected row or column as a title row or column, mark this checkbox. The application automatically repeats title elements on subsequent pages of multiple-page reports. If you designate multiple elements as a title row, the application prints only the last-selected title element on subsequent pages. For example, if you designate two rows as title rows, the application will print only the second title row on the second and subsequent pages.
- Print zeros. To have the application print the selected elements even if all amounts in the elements are zero, mark this checkbox. Otherwise, the report will not include elements with zero amounts.
- Print distinct values. (Row Properties only) To repeat variables for only unique instances of the client data, mark this checkbox. For example, in the Tax Code Groupings report, the [ChartofAccounts.Accounts.TaxCode] variable requires a unique value for each tax code. This checkbox setting applies to each cell in the selected rows.
- Print total amount. (Column and Cell Properties only) To include the total amount for the amount variables in the selected columns, mark this checkbox. This setting applies to each cell in the selected columns.
- Optional section. To include the selected rows as a section in the report that you can choose to include or exclude from the report at print time, mark this checkbox and then specify a name for the optional section.
- Print by default. To include the optional section by default at print time, mark this checkbox. Otherwise, the application will exclude it by default at print time.
- Repeat right. (Cell Properties only) To designate a cell or cells with a repeating variable that should repeat right rather than down, mark this checkbox.
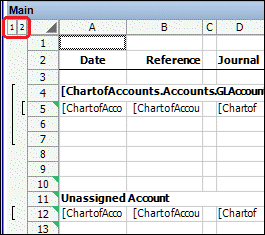
To display the Group Properties section of the Design Tools frame, click the numbered button in the upper-left corner of the region in the design grid that contains the repeating level. Show me.
- Region. Displays the region that corresponds to the current selection.
- Level. Displays the repeating level that corresponds to the current selection.
- Row(s) in group. Displays the row or range of rows for the selected level. (Note that this field cannot be modified.)
- Do not page break within group. To display this data grouping on a single page without carrying forward to the next page, mark this checkbox.
Note: If the selected data grouping is too large to fit on a single page, the application automatically inserts a natural page break.
Was this article helpful?
Thank you for the feedback!

|
|

|
Get the most out of your Thomson Reuters Tax & Accounting products. Our continued learning packages will teach you how to better use the tools you already own, while earning CPE credit. Learn more. |

|
|

|
Chat - Best option for simple questions Call us at +1 800 968 0600. You might like to see our hours and menu options before calling |